
Empty space, drag to resize
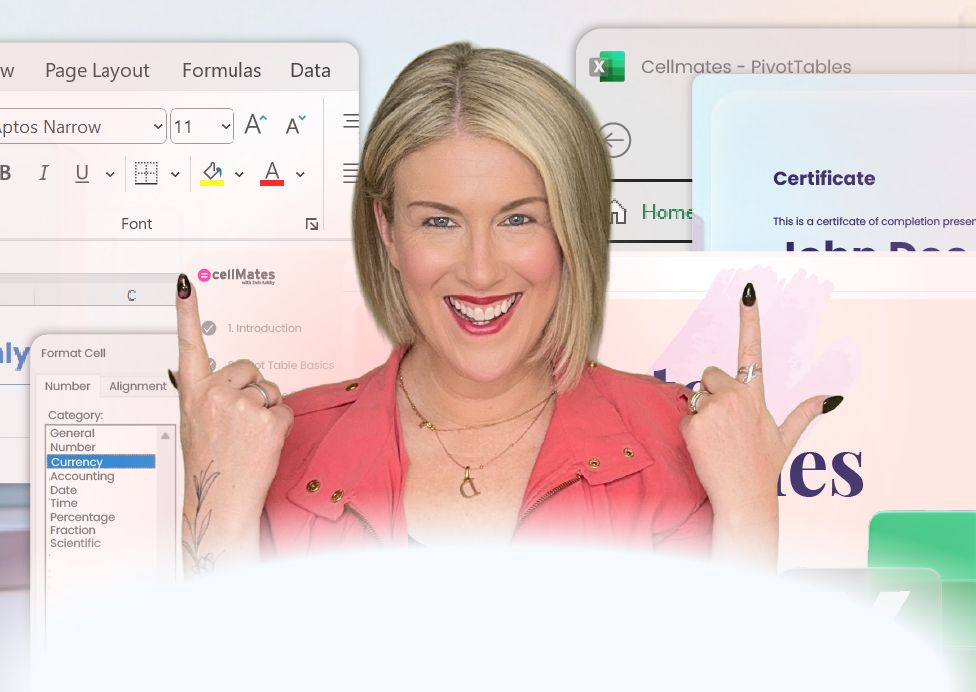
Master PivotTables
with Confidence.
Without the Overwhelm
Master PivotTables
with Confidence.
Without the Overwhelm
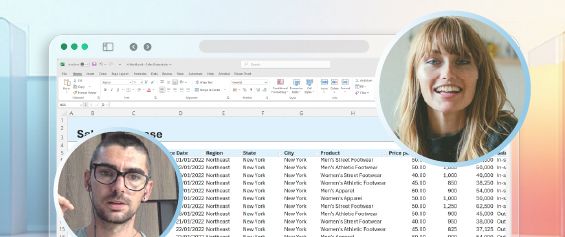
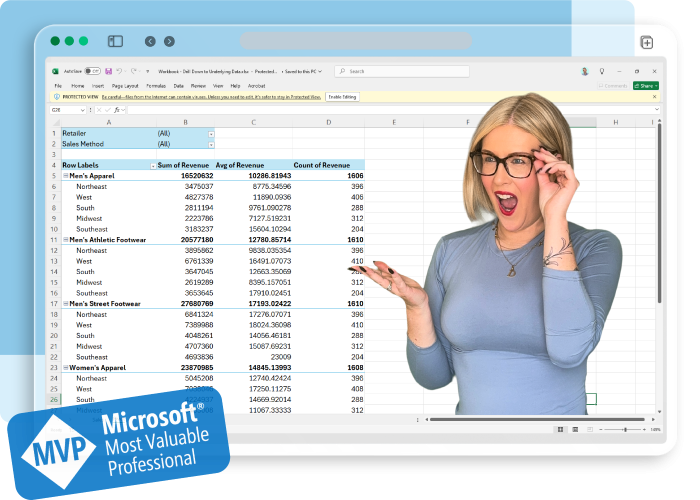
Turn messy Excel spreadsheets into powerful insights with me, Deb Ashby.
Use code DEBLAUNCH50 at checkout and get it today for just $64.50!

Why PivotTables Set You Apart...
Here’s what learners say about mastering PivotTables with me:
Clarity from Chaos
"Excel used to feel overwhelming. Deb’s short, clear videos gave me the practical tips I needed to finally make sense of messy data - and my confidence soared."
Brigid McCormack
Time Back in Your Week
"Deb’s course has saved me hours. She makes complex tools like VBA and macros simple and keeps things engaging. I’m levelling up fast."
Empty space, drag to resize
Monique Azcona
Become the Expert
"Deb’s course didn’t just teach me Excel, it gave me the confidence to present insights and be recognised as an expert. It’s been a real step up for my skills and career."
Empty space, drag to resize
Courtney Barnard
Is This Course Your Missing Piece?
Sound familiar...

Staring at messy spreadsheets, totally overwhelmed

Clicking around in PivotTables, not quite sure what you’re doing

Spending hours Googling how to do one tiny thing

Wanting to impress your team or clients with slick reports

Ready to level up your career with advanced Excel skills

Wishing someone would just show you step by step - without jargon
If this sounds like you, you’re in the right place - and I’m here to help.
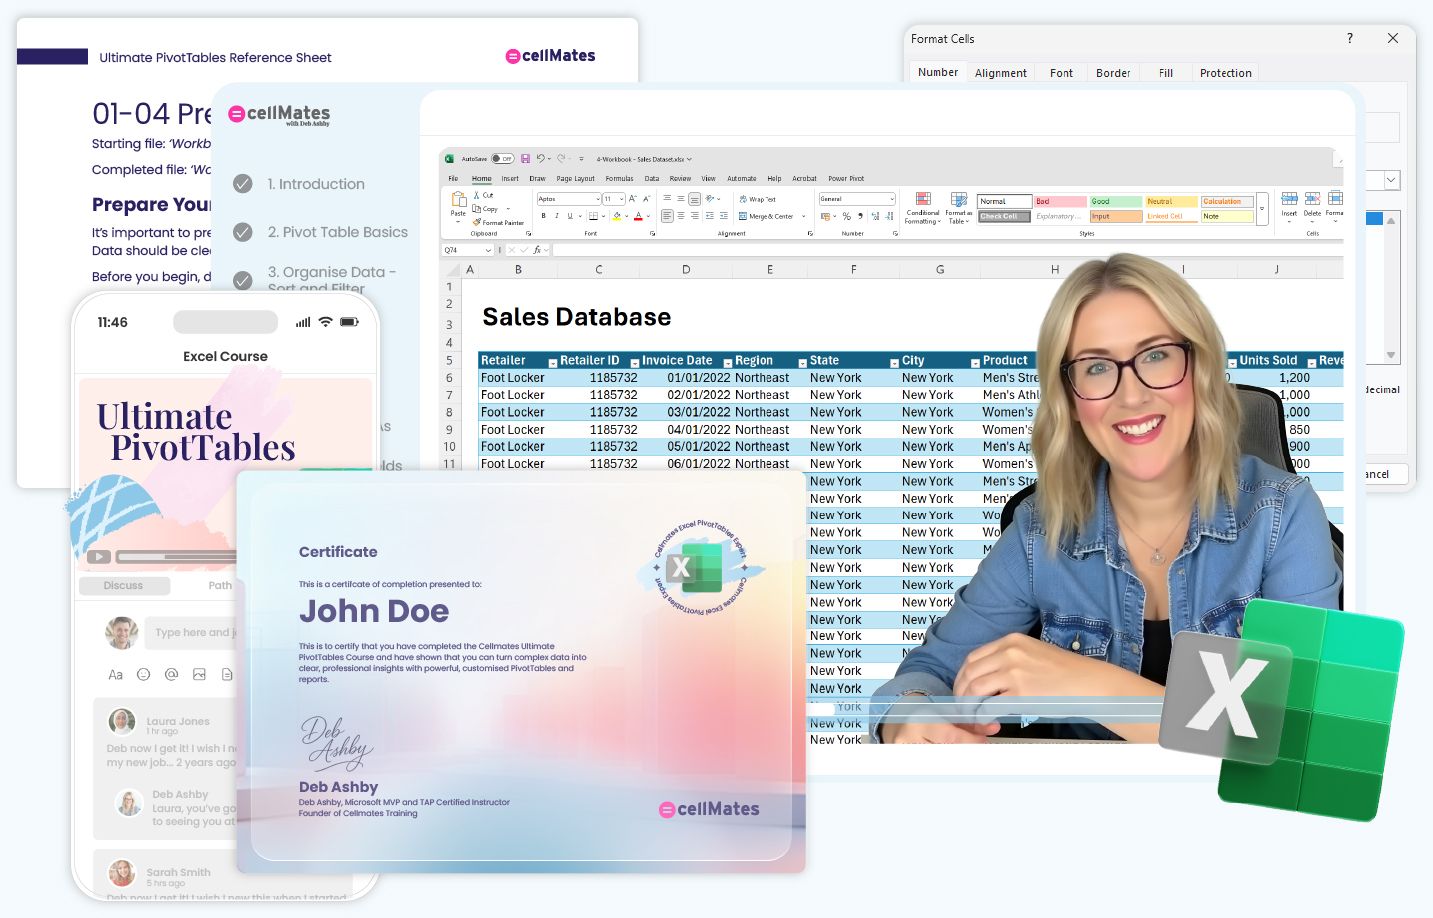
Introducing
The Ultimate PivotTables Course

55+ Bite-Sized, Action-Packed Lessons
Master PivotTables with clear, practical videos you can follow step by step - no jargon, no fluff.

Hands-On Practice Files & Challenges
Work alongside me with real datasets, guided exercises and practical challenges that lock in your skills fast.

Taught by me, Microsoft MVP Deb Ashby
Learn from my years of experience helping millions master Excel - in a style that’s friendly, down-to-earth and gets results.

Lifetime Access & Future Updates
Revisit lessons anytime and stay updated with new tips and features as Excel evolves.

Perfect for Busy Professionals
Learn on your schedule with my on-demand course. Finally feel confident using PivotTables without hours of trial and error.

From Basics to Pro-Level Tricks
Go beyond the “how” and learn clever shortcuts and advanced techniques that help you shine - even under pressure.
Ready to finally get PivotTables?
Join my Ultimate PivotTables Course and turn messy spreadsheets into insights today.
Use code DEBLAUNCH50 at checkout and get it today for just $64.50!
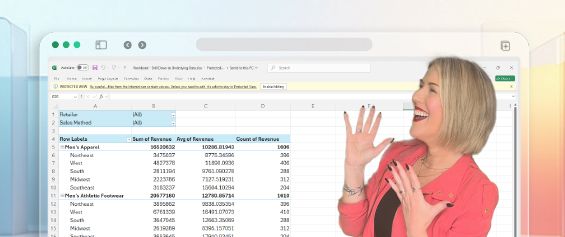
Inside the Ultimate PivotTables Course

Deb’s Ultimate PivotTables course is perfect for anyone serious about growing their Excel skills. I finished feeling confident and ready to tackle complex data tasks at work. A must for professionals who want to stand out and make smarter decisions.”
Ben Perissinotto
Course Curriculum
What We'll Learn Together
Course Agenda:
Introduction
- Course Introduction - 05:08
- Get Comfy with the Dataset - 03:31
- What are Pivot Tables? - 04:41
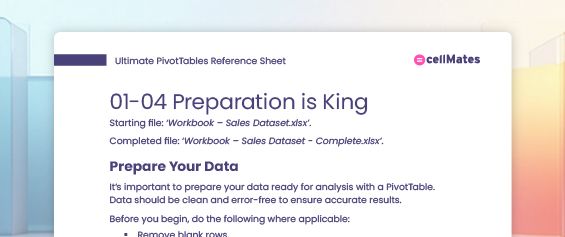
- Preparation is KING - 06:14
- Exercise 01 - 02:29
- Test Your Knowledge - 3 questions
Pivot Table Basics
- Create a Basic Pivot Table - 09:20
- Pivot, Pivot, Pivot the Fields! - 05:05
- Select, Move and Copy Pivot Data - 04:58
- Subtotals and Grand Totals - 03:31
- Aggregation Options - Summarise By - 05:56
- Drill Down to Underlying Data - 02:33
- PRO-TIP: Defer Layout Updates - 02:22
- Exercise 02 - 01:42
- Test Your Knowledge - 3 questions
Organize Data - Sort, Filter and Group
- Basic Sort and Filter Options - 05:26
- Sort with a Custom List - 05:39
- Label and Value Filters - 06:17
- PRO-TIP: Apply Multiple Filters - 02:53
- Automatic Date Grouping - 05:31
- Organize Data by Financial Year - 04:29
- Create Custom Groups - 04:24
- Report Filter Pages - 03:29
- Filter with Slicers and Timelines - 08:40
- Exercise 03 - 01:59
- Test Your Knowledge - 3 questions
Format Pivot Tables and Slicers
- Apply Number Formats the Right Way - 05:13
- Format Empty Cells - 02:57
- Customize Headers - 05:56
- Report Layouts - 04:52
- Create a Custom Pivot Table Style - 07:53
- Set a Default Layout and Style - 04:49
- Import a PivotTable Style - 02:49
- PRO-TIP: Preserve Column Widths - 02:18
- Create a Custom Slicer Style - 08:08
- Apply Conditional Formatting - 07:49
- Custom Number Formatting - 08:34
- Exercise 04 - 02:23
- Test Your Knowledge - 3 questions
Pivot Table Calculations
- Show Values As - Value Calculations - 06:20
- Calculated Fields and Items - 09:05
- Solve Order and List Formula Tools - 06:16
- Exercise 05 - 01:43
- Test Your Knowledge - 3 questions
Pivot Tables + Power Query
- Import and Link Multiple Tables - 08:41
- Merge Multiple PivotTables - 06:55
- Append Tables with Power Query - 08:50
- Folders and Power Query - 09:04
- Exercise 06 - 02:15
- Test Your Knowledge - 3 questions
Visualize Data with Pivot Charts
- Data Visualization 101 - 05:22
- Create a Basic Pivot Chart - 12:24
- Format a Pivot Chart - Part 1 - 10:18
- Format a Pivot Chart - Part 2 - 10:16
- PRO-TIP: Pivot Chart Troubleshooting - 08:59
- Create a Map Chart from Pivot Data - 06:17
- Connect Slicers to Pivot Charts - 07:43
- Add a Dynamic Chart Title - 04:14
- Update Pivot Tables and Charts - 03:49
- Exercise 07 - 02:53
- Test Your Knowledge - 3 questions
Structured Reports
- Dynamic Reports with GETPIVOTDATA - 08:09
- PivotTable Style Reports - GROUPBY and PIVOTBY [M365 Only] - 11:52
- Highlight MIN and MAX values - GETPIVOTDATA and IF - 07:35
- Exercise 08 - 02:16
- Test Your Knowledge - 3 questions
AI For Analyzing Data
- AI - Analyze Data and Quick Analysis - 06:04
- Create Pivot Tables and Charts with Copilot [Optional] - 06:26
- Exercise 09 - 02:10
- Test Your Knowledge - 3 questions
Next Steps and Course Close
- Next Steps: Interactive Excel Dashboards - 02:44
- Time to Say Goodbye - 01:17
- Certificate of Completion
Write your awesome label here.
Course Details
Ready to finally master PivotTables? In my Ultimate PivotTables Course, you’ll learn how to:
No jargon. No overwhelm. Just real Excel skills to help you shine at work.
- Build PivotTables from scratch
- Create slick reports and charts
- Perform advanced calculations
- Save time with pro tips and Copilot
No jargon. No overwhelm. Just real Excel skills to help you shine at work.
Time: 6 hours, 7 minutes
Format: On-demand - 55+ Lessons, 8 Exercises
Level: Beginner to Intermediate
Coach: Deb Ashby, Microsoft MVP and TAP Certified Instructor

I used to feel totally overwhelmed trying to figure out PivotTables on my own, but Deb’s Ultimate PivotTables course changed that completely. Her clear, bite-sized lessons made everything click, and the hands-on exercises gave me the confidence to actually use what I’d learnt at work.”
Cara Fudge
Content Project Manager
Amazing video for productivity. I always like your teaching style because of its simplicity.
Abraham Manyang
Thank you very much, you are really an expert in simplifying complex things.
Ezra
I hadn't worked on Excel in years and I'm amazed at what you just taught us all. Thank you.
Olga Palenzuela-King
FANTASTIC. This is by far the best video I have watched on the "FILTER" function, and I have watched a number of them.
Michael Brown
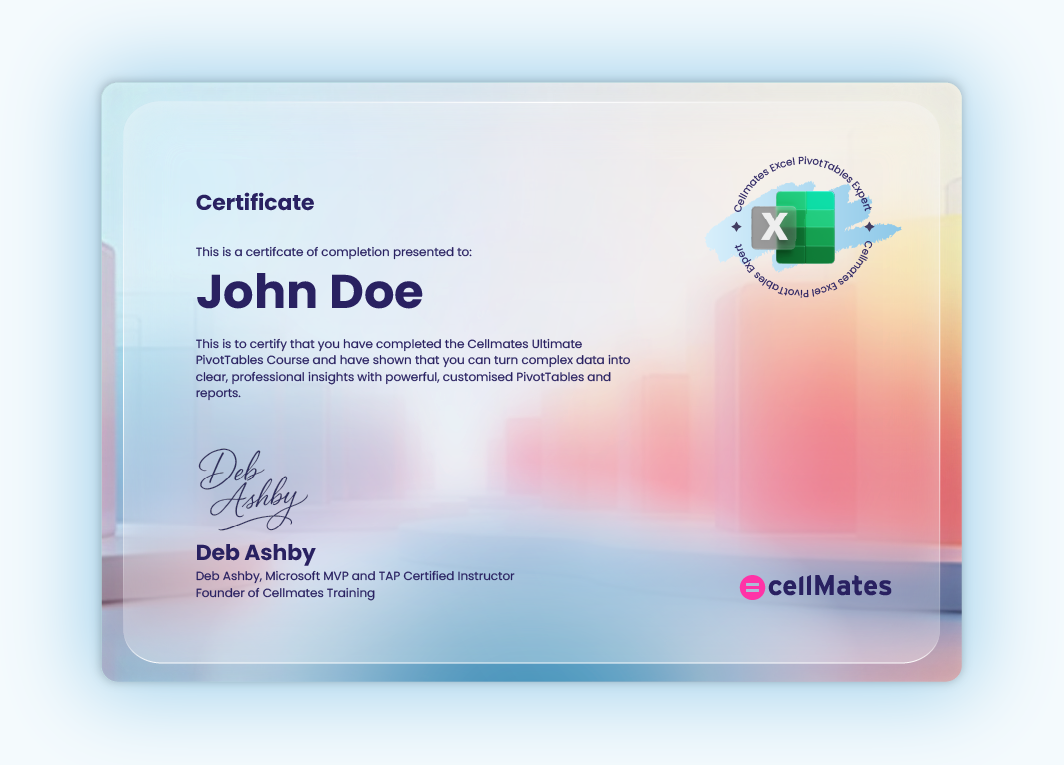
Earn Your Ultimate PivotTables Certificate
-
Complete hands-on exercises that mirror real-life data challenges.
-
Build a polished PivotTable report to showcase your skills.
-
Prove you’ve got what it takes to handle data like a pro.
Use code DEBLAUNCH50 at checkout and get it today for just $64.50!
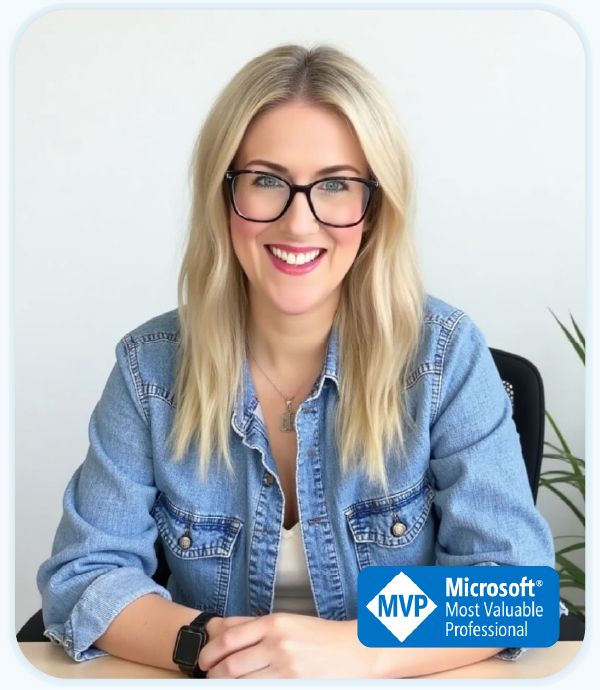
Meet Your Instructor
Deb Ashby
I make Microsoft skills easier to learn - and way more fun.
I'm a Microsoft MVP and LinkedIn Learning instructor with over 300,000 followers and millions of views. I break down the tricky stuff into simple, practical steps - so you can feel confident using the tools that matter and take your career further.
Brands I’ve worked with:

Try It, Love It, or Your Money Back!
30-Day Money-Back Guarantee
I’m confident you’ll get real value from my courses. But if it’s not right for you, just let me know within 30 days and I’ll give you a full refund. No stress. No awkward questions. Just simple, honest support.
Empty space, drag to resize
Frequently Asked Questions
What do I get when I buy a course?
You get instant, lifetime access to all lessons in the course - including step-by-step videos, downloadable resources, and hands-on challenges to help you apply what you’ve learnt.
How do I know if the courses are right for me?
Each course clearly outlines the skill level it’s aimed at - whether you're a total beginner or looking to go pro. You’ll see what’s covered before you buy, so you can choose the course that fits your needs.
How long will I have access?
Forever! Once you purchase a course, it’s yours for life - no expiry.
Do I need Microsoft 365?
Most lessons are taught using Microsoft 365, but you can still follow along if you’re using a slightly older version. Where features differ, I’ll always let you know.
Can I use Google Sheets to complete the Exercises if I don’t have Excel?
Unfortunately, no - PivotTables in Google Sheets are quite different to how they work in Excel.
Do I get a certificate?
Yes! Once you complete the course, you’ll receive a downloadable certificate of completion to celebrate your progress and showcase your skills.
Can I ask questions if I get stuck?
Absolutely. You can comment inside the course platform and I’ll be there to help you out.
How long is the Ultimate PivotTables course?
The Ultimate PivotTables course includes over 55 lessons and 8 practical exercises, with around 6 hours of on-demand content. But you can learn at your own pace and revisit topics anytime.
Can I preview any lessons before I buy?
Will I need to download any special software?
Nope! You just need Microsoft Excel installed on your computer. Everything else - videos, practice files, and exercises - is provided within the course.
How is this different from free tutorials on YouTube?
Great question! My course gives you a complete, comprehensive, structured learning path - not random videos. Plus, you’ll get downloadable resources, practical challenges, and personal support from me so you actually retain what you learn.
Can my company pay for this course?
Definitely. Many employers cover training costs. Feel free to reach out for any details you might need to get it approved internally.
Do you offer group discounts for teams?
Yes! If you’re interested in enrolling multiple people from your team, email me at support@assembleyou.com and we’ll sort out a group discount.
What’s your refund policy?
No worries. If you’ve completed less than 25% of the course, just email me at support@assembleyou.com within 30 days, and I’ll refund you - no fuss, no awkward questions.
I’m not great with tech. Will I be able to keep up?
Yes! My courses are designed to be clear, friendly, and easy to follow - no jargon, just real help. You can pause, rewind, or rewatch anytime.
Celebrate My New Website – 50% Off!
Get lifetime access to the Ultimate PivotTables Course or Microsoft Fundamentals Bundle for half price.
Use promo code at checkout:
DEBLAUNCH50
Use code DEBLAUNCH50 at checkout and get it today for just $64.50!
Let’s Start Mastering
PivotTables Together
Simple, practical and designed with you in mind.
Copyright © 2026
TRAIN I.T NOW LTD, trading as Cellmates Training, is not affiliated with or endorsed by Microsoft.
Microsoft, Microsoft 365, Excel, Teams, Word, Outlook, PowerPoint and Copilot are trademarks of the Microsoft group of companies.
Featured Links
Write your awesome label here.
Course Details
Want to stop second-guessing your Word docs?
In my Word 365 Fundamentals course, I’ll show you how to:
No jargon. No overwhelm. Just practical Word skills to make your working day easier.
Time: 2 hours, 20 minutes
Format: On-demand – 24 Lessons, 3 Exercises
Level: Beginner
Coach: Deb Ashby, Microsoft MVP and TAP Certified Instructor
In my Word 365 Fundamentals course, I’ll show you how to:
- Create polished documents with speed and confidence
- Format text and paragraphs like a pro
- Save time with templates, styles and shortcuts
- Share, convert and collaborate - without the tech stress
No jargon. No overwhelm. Just practical Word skills to make your working day easier.
Time: 2 hours, 20 minutes
Format: On-demand – 24 Lessons, 3 Exercises
Level: Beginner
Coach: Deb Ashby, Microsoft MVP and TAP Certified Instructor
Access This Course and More in My Microsoft Foundations Bundle
Save big, learn faster and build confidence across all the Microsoft 365 apps you use most.
Six Courses for Only: $349
Everything We'll Learn Together:
Get Started with Word 365
- Course Introduction
- Launch Word + Start Screen
- Explore Word Templates
- Save and Reuse a Template
- Create and Save a Document to the Cloud
- Anatomy of a Document
- Ribbons and Menus
- Customise the Quick Access Toolbar
- Find Commands and Get Help
- Key Tips and Shortcuts
- Exercise 01
Work with Text and Paragraphs
- Insert Text into the Document
- Show/Hide Paragraph Marks
- Make Selections in the Document
- Format Paragraphs
- Bullets and Numbered Lists
- The Navigation Pane
- Spell Check and AutoText
- Find and Replace
- Exercise 02
Views and Page Setup
- Views and Modes
- Margins and Orientation
- Convert to PDF
- Share a Document with Others
- Exercise 03
Course Close
- Time to Say Goodbye
- Certificate of Completion
Access This Course and More in My Microsoft Foundations Bundle
Save big, learn faster and build confidence across all the Microsoft 365 apps you use most.
Course Details
Struggle with spreadsheets no more.
In my Excel 365 Fundamentals course, you’ll learn how to:
In my Excel 365 Fundamentals course, you’ll learn how to:
- Enter and clean data without the guesswork
- Use essential formulas that actually make sense
- Format your sheets like a pro (and save time doing it)
- Apply real-world shortcuts that make work faster and easier
Real Excel confidence starts here - with tools that help you finish work faster and feel good doing it.
Time: 2 hours, 35 minutes
Format: On-demand – 23 Lessons, 5 Exercises
Level: Beginner
Coach: Deb Ashby, Microsoft MVP and TAP Certified Instructor
Access This Course and More in My Microsoft Foundations Bundle
Save big, learn faster and build confidence across all the Microsoft 365 apps you use most.
Six Courses for Only: $349
Everything We'll Learn Together:
Get Started with Excel 365
- Course Introduction
- Launch Excel + Start Screen
- Create and Save a Workbook to the Cloud
- Anatomy of a Spreadsheet
- Ribbons and Menus
- Customise the Quick Access Toolbar
- Find Commands and Get Help
- Key Tips and Shortcuts
- Exercise 01
Explore the Interface
- Navigate Around a Spreadsheet
- Make Selections with the Keyboard and Mouse
- Manage and Organise Worksheets
- Delete and Clear Cells, Rows and Columns
- Exercise 02
Enter Values and Apply Formatting
- Input Text and Values
- Basic Number Formats
- Apply Cell Formats
- Exercise 03
Formula Basics
- Anatomy of a Formula
- Basic Calculations: SUM, COUNT, AVERAGE, MIN, MAX
- Order of Calculations - the BODMAS Principle
- Autosum and Autofill
- Exercise 04
Share and Work Online
- Print a Workbook - To Printer and PDF
- Share a Workbook with Others
- Excel On the Go - Work with the Online Portal
- Exercise 05
Course Close
- Time to Say Goodbye
- Certificate of Completion
Access This Course and More in My Microsoft Foundations Bundle
Save big, learn faster and build confidence across all the Microsoft 365 apps you use most.
Course Details
Make your slides stand out - without the stress!
In my PowerPoint 365 Fundamentals course, you’ll learn how to:
• Design clean, professional slides - no designer required
• Use animations and transitions without going over the top
• Present with confidence using built-in PowerPoint tools
• Save time with layouts, themes and tricks that actually work
Feel calm, clear and in control - whether you're presenting to your team, your manager or a crowd.
Time: 2 hours
Format: On-demand – 25 Lessons, 5 Exercises
Level: Beginner
Coach: Deb Ashby, Microsoft MVP and TAP Certified Instructor
Access This Course and More in My Microsoft Foundations Bundle
Save big, learn faster and build confidence across all the Microsoft 365 apps you use most.
Six Courses for Only: $349
Everything We'll Learn Together:
Get Started with PowerPoint 365
- Course Introduction
- Launch PowerPoint + Start Screen
- Explore PowerPoint Templates
- Save a Blank Presentation
- Anatomy of a Presentation
- Ribbons and Menus
- Customise the Quick Access Toolbar
- Find Commands and Get Help
- Key Tips and Shortcuts
- Exercise 01
Work with Slides and Layouts
- Apply Slide Layouts
- Add a New Slide
- Reorder and Delete Slides
- Copy and Move Slides
- Slide Sorter and Views
- Exercise 02
Work with Text
- Work with Placeholders
- Change Font and Colours
- Bullets and Numbering
- Design Themes
- Exercise 03
Insert Pictures, Icons and Shapes
- Insert Images and Icons
- Insert and Format Shapes
- Automatic Slide Layouts - Designer
- Exercise 04
Present to an Audience
- Run a Slideshow
- Add Speaker Notes
- Presentation Tools
- Exercise 05
Course Close
- Time to Say Goodbye
- Certificate of Completion
Access This Course and More in My Microsoft Foundations Bundle
Save big, learn faster and build confidence across all the Microsoft 365 apps you use most.
Course Details
Take back control of your inbox!
In my Outlook 365 Fundamentals course, you’ll learn how to:
- Organise emails, contacts and calendars without the chaos
- Manage tasks and meetings like a pro
- Customise your inbox to work smarter, not harder
- Stay focused with time-saving tools you probably didn’t know existed
No more inbox overload. Just clear, simple systems that make your workday easier to manage.
Time: 1 hour, 55 minutes
Format: On-demand – 25 Lessons, 5 Exercises
Level: Beginner
Coach: Deb Ashby, Microsoft MVP and TAP Certified Instructor
Access This Course and More in My Microsoft Foundations Bundle
Save big, learn faster and build confidence across all the Microsoft 365 apps you use most.
Six Courses for Only: $349
Everything We'll Learn Together:
Get Started with Outlook 365
- Course Introduction
- Explore the Outlook Interface
- Configure a Microsoft Account
- Add a Gmail Account
- Spelling and Grammar Settings
- Customise the Quick Access Toolbar
- Exercise 01
Send and Receive Mail
- Compose a New Message
- Format a Message
- Attach a File to a Message
- Save as a Draft
- Send a Message
- Receive a Message
- Save File Attachments
- Exercise 02
Organise Mail
- Flag Mail for Follow Up
- Assign Mail to Categories
- Create Folders and Subfolders
- Move and Copy Mail
- Delete Mail Permanently
- Archive Mail
- Exercise 03
Outlook Calendar
- Create an Appointment
- Create a Meeting
- Schedule a Teams Meeting
- Exercise 04
Outlook Contacts
- Add a New Contact
- Edit Contact Details
- Exercise 05
Course Close
- Time to Say Goodbye
- Certificate of Completion
Access This Course and More in My Microsoft Foundations Bundle
Save big, learn faster and build confidence across all the Microsoft 365 apps you use most.
Course Details
Stop dreading meetings - start running them like a pro!
In my Microsoft Teams Fundamentals course, you’ll learn how to:
- Set up and run meetings that feel smooth and stress-free
- Share content and collaborate without awkward pauses
- Stay on top of chats, channels and notifications
- Organise your team’s work so nothing gets lost
No more panic before a presentation. Just simple steps to make Teams work for you - not the other way round.
Time: 2 hours
Format: On-demand – 23 Lessons, 5 Exercises
Level: Beginner
Coach: Deb Ashby, Microsoft MVP and TAP Certified Instructor
Access This Course and More in My Microsoft Foundations Bundle
Save big, learn faster and build confidence across all the Microsoft 365 apps you use most.
Six Courses for Only: $349
Everything We'll Learn Together:
Get Started with Teams
- Course Introduction
- Teams Desktop vs Teams Online
- Explore Teams Dashboard
- Use Teams as a Guest
- Exercise 01
Create a Team and Add Members
- Create a New Team
- Add Members to a Team
- Manage Teams and Members
- Add a Channel
- Exercise 02
Join a Team
- Join a Public Team
- Invite Others to a Private Team
- Join a Private Team
- Exercise 03
Conversations
- Start a New Conversation
- Format a Message
- Edit and Delete Messages
- Send Private Messages
- Mentions
- Share Files in Conversations
- Exercise 04
Audio and Video Meetings
- Start an Adhoc Meeting (Meet Now)
- Schedule a Meeting
- Add Meeting Participants
- Record a Meeting
- Share Your Screen
- Exercise 05
Course Close
- Time to Say Goodbye
- Certificate of Completion
Access This Course and More in My Microsoft Foundations Bundle
Save big, learn faster and build confidence across all the Microsoft 365 apps you use most.
Course Details
Your AI assistant awaits - let’s make work lighter!
In my Copilot 365 Fundamentals course, you’ll learn how to:
- Use Copilot to draft emails, reports and summaries in seconds
- Turn complex data into instant insights using AI prompts
- Save hours by letting Copilot handle repetitive tasks
- Build confidence using one of Microsoft’s most powerful new tools
It’s not about knowing AI. It’s about making it work for you - right inside the apps you already use.
Time: 1 hour, 10 minutes
Format: On-demand – 18 Lessons, 4 Exercises
Level: Beginner
Coach: Deb Ashby, Microsoft MVP and TAP Certified Instructor
Access This Course and More in My Microsoft Foundations Bundle
Save big, learn faster and build confidence across all the Microsoft 365 apps you use most.
Six Courses for Only: $349
Everything We'll Learn Together:
Get Started with Copilot
- Course Introduction
- Copilot Versions
- Copilot Pre-requisites
- Exercise 01
Copilot in Excel
- Create Formulas like a PRO with Copilot
- Analyse Data with PivotTables and Charts
- Sort and Filter Data
- Apply Conditional Formatting
- Ask Copilot Questions
- Exercise 02
Copilot in PowerPoint
- Draft a Presentation from Scratch
- Summarise your Presentation
- Organise and Manage Slides
- Use your Organisations Templates with Copilot
- Exercise 03
Copilot in Word
- Draft a Document with Copilot
- Transform Existing Content
- Summarise Long Documents
- Get Answers to Questions
- Exercise 04
Course Close
- Next Steps: Copilot in Other Microsoft Applications
- Course Close
- Certificate of Completion
Access This Course and More in My Microsoft Foundations Bundle
Save big, learn faster and build confidence across all the Microsoft 365 apps you use most.